SSAS (SQL Server Analysis Services) is a Microsoft BI (Business Intelligence) technology used for online analytical processing (OLAP) and data mining. Here are some important SSAS terminology:
Cube: A cube is a multidimensional structure that contains measures and dimensions. It organizes data into a structure that is optimized for querying and analysis.
Dimension: Dimensions are the categories by which data is analyzed. They provide the context for measures in a cube. Examples of dimensions include Time, Geography, Product, etc.
Measure: Measures are the numeric values that are being analyzed. Examples of measures include Sales Amount, Quantity Sold, Profit Margin, etc.
Hierarchy: Hierarchies are logical structures that organize dimension attributes into levels of detail. For example, a Time dimension might have a hierarchy with levels such as Year, Quarter, Month, and Day.
Attribute: Attributes are the individual members within a dimension hierarchy. For example, within a Time dimension, attributes might include Year, Quarter, Month, and Day.
Fact Table: A fact table is a central table in a star schema or snowflake schema that contains the quantitative data for analysis. Measures in a cube are derived from the columns in the fact table.
MDX (Multidimensional Expressions): MDX is the query language used to query multidimensional data stored in SSAS cubes. It is similar in syntax to SQL but is specifically designed for querying OLAP data.
Aggregation: Aggregations are pre-calculated summary values stored within the cube to improve query performance. Aggregations are created based on the measures and dimensions defined in the cube.
Partition: A partition is a physical storage container within a cube that holds a subset of data from the underlying data source. Partitions allow for parallel processing and efficient querying.
Data Source View (DSV): A data source view defines the schema and relationships between the tables and views used as the data source for an SSAS project.
KPI (Key Performance Indicator): KPIs are business metrics used to evaluate the performance of an organization. SSAS allows for the definition and analysis of KPIs within cubes.
Mining Model: In SSAS, data mining models are used to identify patterns and relationships in data. These models can be created using algorithms such as Decision Trees, Clustering, Neural Networks, etc.
Data warehouse architecture is the design and building blocks of the modern data warehouse. With the evolution of technology and demands of the data-driven economy, multi-cloud architecture allows for the portability to relocate data and workloads as the business expands, both geographically and among the major cloud vendors such as Amazon and Microsoft.
There are three approaches to constructing a data warehouse:
Bottom Tier
The bottom tier or data warehouse server usually represents a relational database system. Back-end tools are used to cleanse, transform and feed data into this layer.
Middle Tier
The middle tier represents an OLAP server that can be implemented in two ways.
The ROLAP or Relational OLAP model is an extended relational database management system that maps multidimensional data process to standard relational process.
The MOLAP or multidimensional OLAP directly acts on multidimensional data and operations.
Top Tier
This is the front-end client interface that gets data out from the data warehouse. It holds various tools like query tools, analysis tools, reporting tools, and data mining tools.
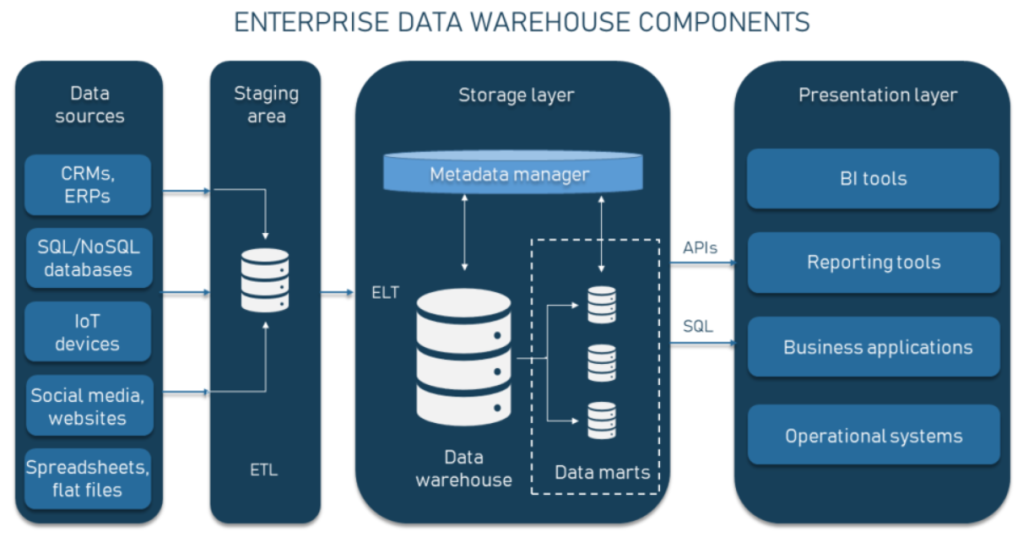
COMPONENTS OF DATA WAREHOUSE ARCHITECTURE
1. Data Warehouse Database
The essential component of data warehouse, a database stores and provides access to all business data. Cloud-based database services include Amazon Redshift and Azure SQL.
2. Extraction, Transformation, and Loading Tools (ETL)
Traditional ETL tools extract data from various sources, transform it into a digestible format, and load it into a data warehouse.
3. Metadata
Metadata provides a framework for and descriptions of data, enabling the construction, storage, handling, and use of the data.
4. Data Warehouse Access Tools
Access tools allow users to discover actionable information from warehouse data. These warehouse tools can include query and reporting tools, application development tools, data mining tools, and OLAP tools.
Data Warehouse Concepts have the following characteristics:
Subject-Oriented :
A data warehouse is subject-oriented since it provides topic-wise information rather than the overall processes of a business. Such subjects may be sales, promotion, inventory, etc. For example, if you want to analyze your company’s sales data, you need to build a data warehouse that concentrates on sales. Such a warehouse would provide valuable information like ‘who was your best customer last year?’ or ‘who is likely to be your best customer in the coming year?’
Integrated :
A data warehouse is developed by integrating data from varied sources into a consistent format. The data must be stored in the warehouse in a consistent and universally acceptable manner in terms of naming, format, and coding. This facilitates effective data analysis.
Time-variant :
Data once entered into a data warehouse must remain unchanged. All data is read-only. Previous data is not erased when current data is entered. This helps you to analyze what has happened and when.
Non-volatile :
The data stored in a data warehouse is documented with an element of time, either explicitly or implicitly. An example of time variance in Data Warehouse is exhibited in the Primary Key, which must have an element of time like the day, week, or month.
OLAP stands for Online Analytical Processing. OLAP systems have the capability to analyze database information of multiple systems at the current time. The primary goal of OLAP Service is data analysis and not data processing.
OLTP stands for Online Transaction Processing. OLTP has the work to administer day-to-day transactions in any organization. The main goal of OLTP is data processing not data analysis.
OLTP and OLAP both are online processing systems.
OLTP is an online database modifying system, whereas OLAP is an online database query answering system.
ONLINE TRANSACTION PROCESSING SYSTEM (OLTP)
OLTP system is mainly focused on the record the current Insertion, Update, and Deletion while transaction.
OLTP system is traditional DBMS data is always detailed and organized.
OLTP is a market-oriented process. It helps to increase the user’s self- service and productivity.
EXAMPLE:
OLTP is a system that manages transaction-oriented applications on the internet, for example, ATM, Online banking, Sending a text message, Order entry, etc.
ONLINE ANALYTICAL PROCESSING SYSTEM (OLAP)
OLAP mainly focuses on extract information from a large database and analyze it for decision making. It helps to plan, problem-solving and decision support.
OLAP allows only read and rarely write operation for that mostly select query used.
Denormalization removes the dependability among the tables which in terms reduces the number of tables. The large sum of data using denormalization is the best solution.
The transactions in OLAP are less frequent as compared to OLTP.
EXAMPLE:
OLAP is an online system that reports to multidimensional analytical queries like financial reporting, forecasting, etc.
The example for OLAP is to view a financial report, or budgeting, marketing management, sales report, etc. It stores historical data that has been inputted by OLTP.
DIFFERENCE BETWEEN OLTP AND OLAP
Data:
OLTP and its transactions are the sources of data.
In OLAP different OLTPs database becomes the source of data for OLAP.
Transaction:
OLTP has short transactions, whereas OLAP has long transactions.
Normalization:
OLTP database has normalized tables (3NF).
The tables in the OLAP database are denormalized. A denormalized form is a form in which a table where it is not dependent on another table for data.
Queries:
The OLTP queries are simpler and short and hence require less time and space while processing.
OLAP also allows a user to execute complex queries to extract multidimensional data.
Integrity:
OLTP database gets updated frequently. A transaction in OLTP may fail in the middle, which may affect data integrity.
OLAP database does not get frequently modified. Hence, data integrity is not affected.
A data warehouse is a centralized repository of digitally stored business information used to drive reporting and data analysis. It consists of massive quantities of data extracted from numerous sources, such as relational databases, internal applications, transactional systems, and external partner systems, aggregated into unified, well-structured historical data.
Data warehouse is usually populated with data from an operational database, which contains transactions. The process of populating the data warehouse is called Extract, Transform, and Load (ETL). This process cleans, transforms, and loads the data into the data warehouse. Once the data is in the data warehouse, it can be used for reporting and analysis.
Data warehouses are used to support business intelligence applications. Business intelligence applications are used to make decisions about the operation of the business. Lets discuss more about Data warehouses in next articles.
Slowly Changing Dimensions in Data Warehouse is an important concept that is used to enable the historic aspect of data in an analytical system. As you know, the data warehouse is used to analyze historical data, it is essential to store the different states of data.
In data warehousing, we have fact and dimension tables to store the data. Dimensional tables are used to analyze the measures in the fact tables. In a data environment, data is initiated at operational databases and data will be extracted-transformed-loaded (ETL) to the data warehouse to suit the analytical environment.
Customer, Product are examples for Dimensional tables. These dimension attributes are modified over time and in the data warehouse, we need to maintain the history. In operational systems, we may overwrite the modified attributes as we may not need the historical aspects of data. Since our primary target in data warehousing is to analyze data with the perspective of history, we may not be able to simply overwrite the data and we need to implement special techniques to maintain the history considering analytical and volume aspects of the data warehouse. This implementation is done using Slowly Changing Dimensions in Data Warehouse.
What are the types of SCD?
Very simply, there are 6 types of Slowly Changing Dimension that are commonly used, they are as follows:
SCD Type
Summary
Type 0
Fixed Dimension
Type 1
No History Update record directly, there is no record of historical values, only current state is maintained.
Type 2
Row Versioning Track changes as version records with current flag & active dates and other metadata
Type 3
Previous Value column Track change to a specific attribute, add a column to show the previous value, which is updated as further changes occur
Type 4
A new dimension will be added. Show current value in dimension table but track all changes in separate table
Type 6
Hybrid SCD Utilize techniques from SCD Types 1, 2 and 3 to track change
In reality, only types 0, 1 and 2 are widely used, with the others reserved for very specific requirements.
Examples
We have a very simple ‘customer’ dimension, with just 2 attributes – Customer Name and Country:
However, Bob has just informed us that he has now moved to the US and we want to update our dimension record to reflect this. We can see how the different SCD types will handle this change and the pro/cons of each method.
Type 0
Our table remains the same. This means our existing reports will continue to show the same figures, maybe it is a business requirement that each customer is always allocated to the country they signed up from.
All future transactions associated to Bob will also be allocated to the ‘United Kingdom’ country.
Type 1
The table is updated to reflect Bob’s new country:
All fact records associated with Bob will now be associated with the ‘United States’ country, regardless of when they occurred.
We often just want to see the current value of a dimension attribute – it could be that the only dimension changes that occur are corrections to mistakes, maybe there is no requirement for historical reporting.
Type 2
In order to support type 2 changes, we need to add four columns to our table:
· Surrogate Key – the original ID will no longer be sufficient to identify the specific record we require, we therefore need to create a new ID that the fact records can join to specifically.
· Current Flag – A quick method of returning only the current version of each record
· Start Date – The date from which the specific historical version is active
· End Date – The date to which the specific historical version record is active
With these elements in place, our table will now look like:
This method is very powerful – you maintain the history for the entire record and can easily perform change-over-time analysis. However, it also comes with more maintenance overhead, increased storage requirement and potential performance impacts if used on very large dimensions.
Type 2 is the most common method of tracking change in data warehouses.
Type 3
Here, we add a new column called “Previous Country” to track what the last value for our attribute was.
Note how this will only provide a single historical value for Country. If the customer changes his name, we will not be able to track it without adding a new column. Likewise, if Bob moved country again, we would either need to add further “Previous Previous Country” columns or lose the fact that he once lived in the United Kingdom.
Type 4
There is no change to our existing table here, we simply update the record as if a Type 1 change had occurred. However, we simultaneously maintain a history table to keep track of these changes:
Our Dimension table reads:
Whilst our Type 4 historical table is created as:
Depending on your requirements, you may place both ID and Surrogate Key onto the fact record so that you can optimise performance whilst maintaining functionality.
Separating the historical data makes your dimensions smaller and therefore reduces complexity and improves performance if the majority of uses only need the current value.
However, if you do require historical values, this structure adds complexity and data redundancy overheads. It is generally assumed that the system will use Type 1 or Type 2 rather than Type 4.
Type 6
The ‘Hybrid’ method simply takes SCD types 1, 2 and 3 and applies all techniques. We would maintain a history of all changes whilst simultaneously updating a “current value” column on all records.
This gives you the ability to provide an element of change comparison without additional calculation, whilst still maintaining a full, detailed history of all changes in the system.
Conclusion
Slowly Changing Dimensions in Data Warehouse are used to perform different analyses. This article provides details of how to implement Different types of Slowly Changing Dimensions such as Type 0, Type 1, Type 2, Type 3, Type 4 and Type 6. Type 2 and Type 6 are the most commonly used dimension in a data warehouse.
Dimension table contains the data about the business. The primary keys of the dimension tables are used in Fact tables with Foreign key relationship. And the remaining columns in the dimension is normal data which is the information about the Objects related to the business.Eg: Product,Customer,Orders,Company,Date etc.
Slowly Changing Dimensions (SCD) :
Slowly changing dimensions refer to how data in your data warehouse changes over time. Slowly changing dimensions have the same natural key but other data columns that may or may not change over time depending on the type of dimensions that it is.
Slowly changing dimensions are important in data analytics to track how a record is changing over time. The way the database is designed directly reflects whether historical attributes can be tracked or not, determining different metrics available for the business to use.
For example, if data is constantly being overwritten for one natural key, the business will never be able to see how changes in that row’s attributes affect key performance indicators. If a company continually iterates on a product and its different features, but doesn’t track how those features have changed, it will have no idea how customer retention, revenue, customer acquisition cost, or other marketing analytics were directly impacted by those changes.
Different Types of SCD:
SCD Type
Summary
Type 0
Ignore any changes and audit the changes.
Type 1
Overwrite the changes
Type 2
History will be added as a new row.
Type 3
History will be added as a new column.
Type 4
A new dimension will be added
I will post detailed article on SCD types separately.
2. Rapidly Changing Dimensions:
A dimension is a fast changing or rapidly changing dimension if one or more of its attributes in the table changes very fast and in many rows. Handling rapidly changing dimension in data warehouse is very difficult because of many performance implications.
Example: Patient table with Age, BMI and Weight
3. Conformed Dimension
A conformed dimension is the dimension that is shared across multiple data mart or subject area. Company may use the same dimension table across different projects without making any changes to the dimension tables.
Conformed dimension example would be Customer dimension, i.e. both marketing and sales department can use Customer dimension for their reporting purpose.
4. Junk Dimension
A junk dimension is a grouping of typically low cardinality attributes, so you can remove them from main dimension.
For example, attributes such as flags, weights, BMI (body mass index) etc
5. Degenerated Dimension
A degenerated dimension is a dimension that is derived from fact table and does not have its own dimension table.
For example, receipt number does not have dimension table associated with it. Such details are just for information purpose.
5. Role Playing Dimension
Dimensions which are often used for multiple purposes within the same database are called role-playing dimensions.
For example, you can use a date dimension for “date of sale”, as well as “date of delivery”, or “date of hire”.